Un site que je recommande pour les fans d investissement « quant » quantpedia.com. 3 articles super intéressant à lire en profondeur.
1/ Pragmatic Asset Allocation Model for Semi-Active Investors
2/A Few Thoughts on Pragmatic Asset Allocation
3/Revisiting Pragmatic Asset Allocation: Simple Rules for Complex Times
1 « J'aime »
Ce qui est intéressant dans ce paier ce n’est pas forcément la stratégie per se mais le raisonement qui conduit à cette stratégie en donnant un bon aperçu des composants d’une allocation dynamique (GTAA, Global Tactical Asset Allocation). Un grand nombre des techniques utilisées pour construire une allocation est rassemblé.
1/les actifs considérés, risquées (Nasdaq, MSCI ACWI, MSCI EM) et défensifs (US10Y - 10 Year US treasury bonds, Gold)
2/règle de rebalance du porfolio en tranches trimestrielles
3/génération des signaux pour sélectionner les actis (Momentum, trend, Cash hedging, Yield curve, Porfolio hedging, Stop Loss)
Concernant l’appréciation de la stratégie, j’en réfère à celle faite par le site allocatesmartly. Le point controversé est l’utilisation de l’inversion de la courbe taux long/taux court pour passer des actifs risqués au actifs défensifs. Il se trouve que la courbe des taux a été durablement inversée ces dernières années si bien que la stratégie a été durablement non investie en actions.
Inverted yield curve:
When the US Treasury yield curve is inverted, the strategy automatically moves the entire portfolio to defensive assets. The criteria used is the 3-month UST yield exceeding the 10-year yield.
Since 1926, the yield curve has been inverted about 10% of the time. Historically, an inverted yield curve has been a leading indicator of poor future performance for risk assets. In the graph below we show the 10-year yield minus the 3-month yield. Negative values would indicate inversion and a move to defensive assets.
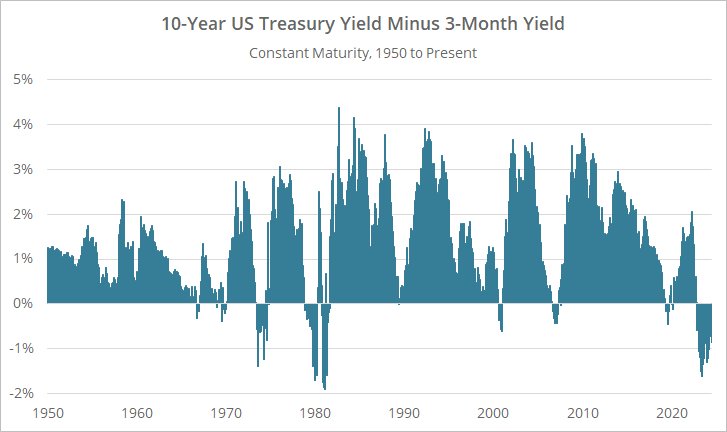
The yield curve has now been inverted for 20 months (based on month-end data), the longest period of inversion since at least 1926. Obviously, we haven’t seen signs of corresponding weakness in risk assets. That’s a lot of time spent on the sideline based on one single measure of market health.
Side note: the authors provide an alternate way to interpret the yield curve here.
We’re not going to comment on the fundamentals of why “this time is different” and yield curve inversion isn’t portending weakness (yet); that’s not what we do. What we will say is we would be cautious of putting so much emphasis on any single economic data point.
Asset prices don’t lie; they reflect investors’ collective valuation at that moment in time. Economic data can be much more ambiguous, and while we think it has value, we wouldn’t determine our entire portfolio’s risk posture based solely on a single data point.
We prefer the more nuanced approach to economic data taken by strategies like Growth-Trend Timing or Paul Novell’s SPY-COMP. We are wary of heavy-handed approaches to economic data taken by strategies like TrendYCMacro and Paul Choi’s Dividend and Growth Allocation.

1 « J'aime »
Comme vu précédemment le problème d’utiliser la courbe d’inversion des taux comme signal est sa latence, longue persistance du signal qui peut conduire à une sous exposition aux actifs riqués comme maintenant. Ceci peut etre compatible avec une stratégie qui rebalance par tranches, trimestriellement.
Maintenant pour des stratégies à rebalancement mensuel, il y a 2 signal macros que j’utilise, avec des temps de réaction plus rapide, tous les 2 aussi disponibles sur le site de la FED.
le premier est the spread between Moody’s Seasoned Baa Corporate Bond© (Moody's Seasoned Baa Corporate Bond Yield (DBAA) | FRED | St. Louis Fed) and 10-Year Treasury Constant Maturity (BC_10YEAR).
actifs risqués vers cash quand le % d’augmentation > 0 sur les 2 dernier mois.

le second est le Chicago Fed National Financial Conditions Credit Subindex (NFCICREDIT)
actifs risqués vers cash si indice > 0
« Positive values of the NFCREDITI indicate credit conditions that are tighter than average, while negative values indicate credit conditions that are looser than average. »
vue historique

vue depuis 2020, « étonnant non » comme aurait dit le regretté Desproges

Ah, j’étais complètement passé à côté de ce post. C’est intéressant cet indicateur de spread entre les obligations corporate et les govvies. Tu l’exploites comment en pratique ?
Tu alloues un capital au suivi de ce signal (swicth equity > safe lorsque le spread a augmenté ces deux derniers mois) ? Tu t’en sers comme un filtre ? Tu blendes plusieurs signaux ?
A la fin de chaque mois (m), je calcule le spread 2 mois auparavant (m-2) en % ce aue je considère comme la valeur de risque. Comme je rebalance mon portfolio mensuellement, au début de chaque mois je réalloue mon risque en fonction de cet indicateur. SI >0 je passe en cash la partie risquée de mon allocation, si <=0 allocation risquée.
La colonne risque du tableau te donne les valeurs pour l’année en cours.
| Date | RISK |
|---|---|
| 2025-05-31 00:00:00 | 21.11801242 |
| 2025-04-30 00:00:00 | 18.49315068 |
| 2025-03-31 00:00:00 | 11.03448276 |
| 2025-02-28 00:00:00 | 3.546099291 |
| 2025-01-31 00:00:00 | -0.684931507 |
| 2024-12-31 00:00:00 | -14.54545455 |
| 2024-11-30 00:00:00 | -15.60693642 |
| 2024-10-31 00:00:00 | -3.50877193 |
| 2024-09-30 00:00:00 | 11.61290323 |
| 2024-08-31 00:00:00 | 16.32653061 |
| 2024-07-31 00:00:00 | 8.391608392 |
| 2024-06-30 00:00:00 | -1.342281879 |
| 2024-05-31 00:00:00 | -8.917197452 |
| 2024-04-30 00:00:00 | -8.588957055 |
| 2024-03-31 00:00:00 | -3.086419753 |
| 2024-02-29 00:00:00 | -4.678362573 |
| 2024-01-31 00:00:00 | -15.18324607 |
D’aprés ce signal pas d’asset risqué depuis début mars. Et ce signal a flashé rouge 44% du temps depuis 1986. Donc très conservateur.
Non mais dans mon trading j’ utilise aussi le NFCICREDIT de la fed avec une allocation graduelle au risque, 100%, 50%, 25%, 0% cash je reviendrais dessus .
Tu as envisagé de moduler l’exposition au risque entre un min et un max selon une valeur normalisée du signal ? Intuitivement l’intensité du signal pourrait être reliée au risque anticipé par le marché, ça pourrait avoir du sens d’utiliser le signal comme un modulateur d’exposition.
Par exemple :
- tu sors la série temporelle de l’indice
- tu élimines les outliers (mettons 5ème et 95ème centiles) pour déterminer un seuil haut et bas du signal
- tu mesures chaque mois le signal
- tu proratises par rapport aux extrêmes => ça te donne une exposition qui varie entre 0 et 100 (ou entre un min et un max)
Ca reste une approche simple, qui donne des résultats satisfaisants sur d’autres signaux (c’est plus ou moins l’approche « naïve » avec le Shiller CAPE que donne Asness pour illustrer le pilotage d’allocation value (Back in the Hunt).
1 « J'aime »
OK super, ca m’intéresse, je vais tester ça.
NFCICREDIT comme indicateur de risque du marché.
Description par la fed ; the credit subindex is composed of measures of credit conditions.
Valeure négative (V-) = condition de crédit bonne
Valeure positive (V+)= condition de crédit difficile
Tendance négative sur 4 semaines (T-) = amélioration des conditions de crédit
Tendance positive sur 4 semaines (T+) = dégradation des conditions de crédit
au début du mois l’allocation est la suivante
si V- et T- 100% en actions
si V- et T+ 75% en actions
si V+ et T- 50% en actions
si V+ et T+ 0% en actions
la distribution de l’allocation est la suivante
| value | #semaines | percentage | Allocation actions |
|---|---|---|---|
| V- T- | 243 | 13.57 | 100% |
| V- T+ | 412 | 23 | 75% |
| V+ T- | 570 | 31.83 | 50% |
| V+ T+ | 566 | 31.6 | 0% |
Impact de l’utilisation de cet indicateur sur trading momentum SP500 jan 1994-30/4/2025.
reduction du drawdown de -70% à -24%. Le sharpe est calculé avec un risk free moyen sur la période de 3.81%. Dataset souscription Norgatedata, historique sans biais du survivant (ne sont investis que de des valeures effectivement listées à la période du backtest).
| Strategie | Momentum (Trend Clarity) | Momentum (Trend Clarity) | Momentum (Trend Clarity) | Momentum (Trend Clarity) | |||||
|---|---|---|---|---|---|---|---|---|---|
| Frequence | Mensuel | Mensuel | Mensuel | Mensuel | |||||
| Market | SP500 1992-2025 | SP500 1992-2025 | SP500 1992-2025 | SP500 1992-2025 | |||||
| Hedging indicator | Pas de hedging | Pas de Hedging | NFCICREDIT | NFCICREDIT | |||||
| allocation par position | Equal weight | Volatility weighted | Equal weight | Volatility weighted | |||||
| CAGR | 21 | 20 | 20 | 18 | |||||
| Sharpe | 1 | 1 | 1.28 | 1.25 | |||||
| Mdd | -70% | -69% | -24% | -24% | |||||
| UPI | 1.5 | 1.45 | 4.44 | 4.03 |
Merci Vincent pour cette info que j’ai mis en pratique. Voilà les résultats toujours en utilisant ma stratégie de Momentum (Variante trend clarity).
Je prends la série de la fed Moody’s Seasoned Baa Corporate Bond Yield Relative to Yield on 10-Year Treasury Constant Maturity (BAA10Y). Je la transforme en utilisant la formule comme indiquée dans ton post en faisant attention de ne pas introduire de look ahead biais. Ce qui me donne effectivement un poids pour allouer le capital (modulateur d’exposition). Si je prends la formule exacte comme dans l’article Back in the hunt, ça donne

L’allocation du capital est = capital * poids. On voit donc qu’en condition favorable le capital est leveragé à 1.5 (150% actions momentum), en période défavorable on sous expose avec un poids minimum de 0.20 (20% du capital alloué).
A la recherche de réduction du max DD et non du max CAGR, je recalcule le poids en utilisant le meme indice BAA10Y, en capant l’exposition max à 1.0 (donc zéro leverage) et à min 0.0. Je réduis considérablement mon exposition au risque (allocation 100% cash si condition défavorable) mais pas de leverage si condition favorable (100% momentum). Voici les poids recalculés.

Comparaison d’une stratégie momentum avec 3 allocations risquée, conservatrice, modérée. Regardez le max DD, 22% en allocation conservatrice en maintenant un sharpe au dessus de 1.
| Strategy | Momentum Trend Clarity | ||
|---|---|---|---|
| Market | SP500 | ||
| Data Set | Norgatedata | ||
| Duration | 1994-May 2025 | ||
| Capital allocation | Aggressive | Conservatrice | Moderate |
| Max weight | 1.5 | 1 | 1.2 |
| Min weight | 0.2 | 0 | 0 |
| Cagr | 28% | 17% | 21% |
| Volatility | 31% | 19% | 23% |
| Sharpe (RF =3.81%)) | 1.18 | 1.1 | 1.14 |
| Max DD | -55.00% | -22% | -34% |
| UPI | 2.72 | 3.50 | 3.05 |
Rendements sur des dates remarquables
2001 -1.44%
2008 -16.72%
2022 -5.61%
2025 3.50%

et pour finir j’aime bien la distribution des rendements mensuels (pas de outliers)

1 « J'aime »
J’adore lire vos échanges @ZakZak et @vincent.p, mais parfois…

4 « J'aime »
Mmmh, l’allocation modulée n’a pas mieux fonctionné qu’un switch on/off sur le signal. Le tableau pourrait tout de même changer si l’on tient compte des taxes et des frais, car l’allocation modulée fait probablement moins tourner le portefeuille. ![]() A moins que ça ne soit déjà inclus dans ton modèle ?
A moins que ça ne soit déjà inclus dans ton modèle ?
Le diagramme de distribution des rendements me fait aussi remarquer que malgré ses résultats assez stellaires, cette stratégie doit être pénible pour les nerfs : le résultat mensuel le plus fréquent m’a l’air dans le rouge.
En tout cas, c’est très cool d’avoir exploré la strat’. Il faudra qu’on te commande des prestas de quant’ quand on ajoutera des stratégies dynamiques dans Cayas. ![]()
C’est parce que tu n’as pas encore lu le parcours pédagogique sur les stratégies alternatives liquides que je n’ai pas encore écrit. ![]()
4 « J'aime »
Bon une derniere réponse pour la route pour apporter quelques précisions
En fait si, mes précédents posts donnaient les données de perf associées au signal NFCILEVERAGE. Par contre si on compare l’allocation swith off/on et allocation modulée pour le signal BAA10Y (ce qui a été testé) on note une amélioration significative de la perf. on passe d’un sharpe à 0.74 à 1.1 et un max DD de -40% à -22%
| Strategy | Momentum Trend Clarity | |||
|---|---|---|---|---|
| Market | SP500 | |||
| Data Set | Norgatedata | |||
| Duration | 1994-May 2025 | |||
| Capital allocation | Aggressive | Conservatrice | Moderate | |
| Signal | BAA10Y | |||
| Max weight | signal on = 100% actions | 1.5 | 1 | 1.2 |
| Min weight | signal off 100%cash | 0.2 | 0 | 0 |
| Cagr | 12% | 28% | 17% | 21% |
| Volatility | 20% | 31% | 19% | 23% |
| Sharpe (RF =3.81%) | 0.74 | 1.18 | 1.1 | 1.14 |
| Max DD | -40% | -55.00% | -22% | -34% |
| UPI | 1.78 | 2.72 | 3.50 | 3.05 |
En fait le rendement mensuel est positif dans 57% des cas >0 et 71% >=0
Quelques explications sur la distribution, la ligne rouge représente la moyenne des rendements mensuelles. Tu peux voir qu’il y a une majorité d’occurences >=0%

![]() Merci, j’ai ma besace pleines de code à écrire, le grand projet de cet été c’est d’expérimenter les stratégies trading AI (style supervised learning pour commencer). Je posterai sur Cayas quand ce sera pret (pas de deadline
Merci, j’ai ma besace pleines de code à écrire, le grand projet de cet été c’est d’expérimenter les stratégies trading AI (style supervised learning pour commencer). Je posterai sur Cayas quand ce sera pret (pas de deadline ![]() SVP)
SVP)
En tous les cas merci à l’équipe pour tous les échanges.
2 « J'aime »
Oh, my bad.
Avec la classe 0% à 2% indiquée dans la distribution des rendements mensuels, on peut dire que cette strat’ a eu des performances très, très intéressantes dans le passé !
Bon, il faudra que je réfléchisse à y allouer quelques pépettes un de ces jours. ![]()
Merci pour le partage !
Remarque que j’ai le meme problème avec la politique TACO ( Trump always chickens out", soit « Trump se dégonfle toujours »). Je sens que ça doit vouloir dire quelque chose OU PAS.
Les quants souffrent ![]() car le bruit perturbe tous les signaux…
car le bruit perturbe tous les signaux…
Je viens de lire the Humble Investor de D. Rasmussen (de chez Verdad et je tombe sur ce paragraphe “The ultimate market-timing tool: the high-yield spread”, ce que représente exactement l’ indicateur BAA10Y”. Pour le citer “Tighter spreads meaning cheaper costs of borrowing, are associated with tranding equities; stocks that are doing well keep doing well, as easy money flows to yesterday’s winners. …There is a linear relationship between the level of spreads and momentum, when momentum crashing when spreads rise above 7%”
| Figure 2: Average FWD 1M Returns to a Momentum L/S Strategy by HY Spread Level |
|---|

1 « J'aime »